Classical Influences
“…And indeed ’tis no wonder that all the Ancients did so fondly hug the Art, that conducts Man with safety from the the first Principle of his Conception, through all the difficul∣ties and Shocks he encounters both during his Emprisonment in the womb, and in his hazardous Passage from thence into this our World…
(Barret, 1699)
Some of our sources rely heavily on the teachings of medical scholars from Classical Antiquity, while others mention them only to dismiss them. We consider this important as it is one marker of medical writings starting to challenge and rectify ideas on the female body. Though most of our sources make some reference to Classical practitioners, only three (Liébault, Mauriceau, Smellie) cite the exact books and passages of their phrases. The most prominent voices of Classical medical authority which are present in our sources of the Early Modern Era was of Hippocrates, Aristotle, and Galen. As we have seen, their work had an impact on female health through our 16 sources. Since our interest is in how often these authors were cited in-text by the authors on our corpus, we did not verify the citations used nor the sources they used.
Implementation
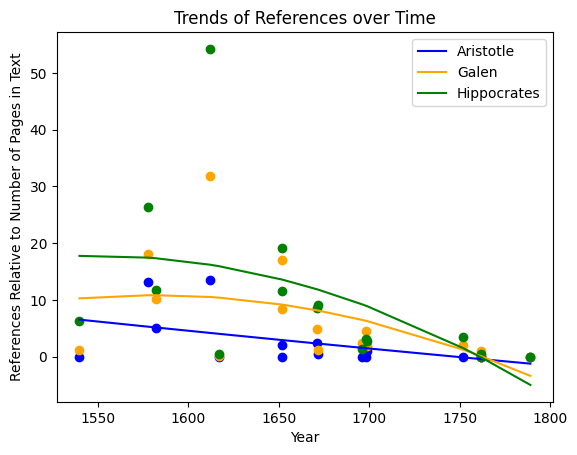
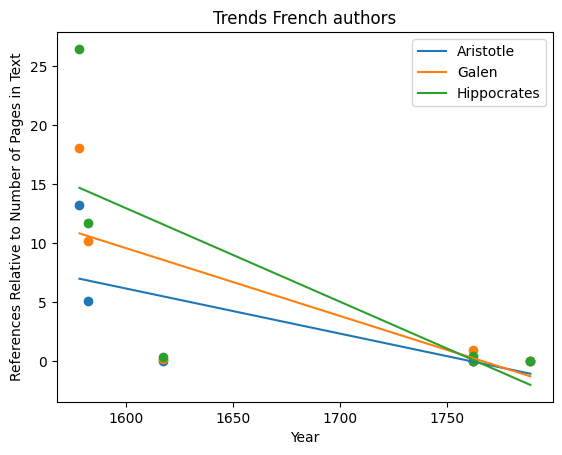
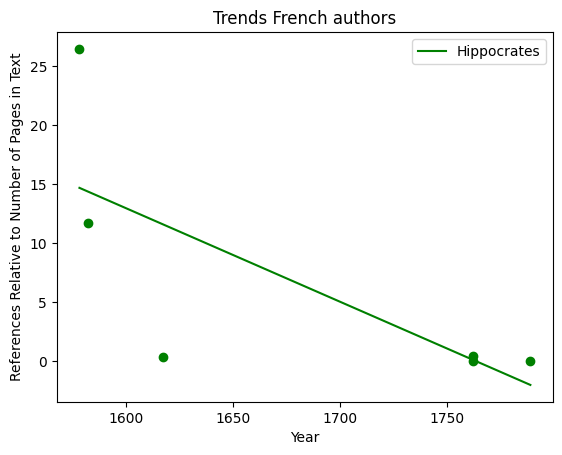
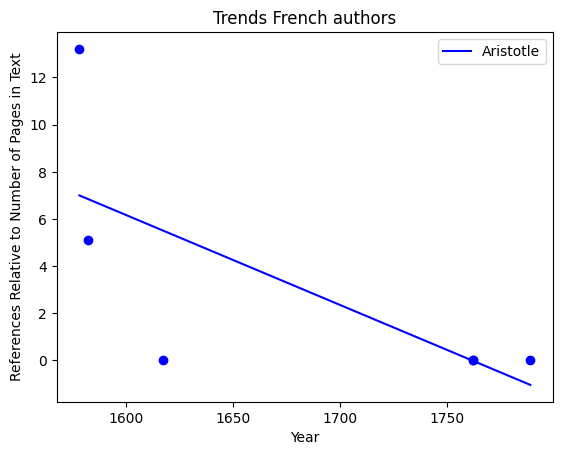
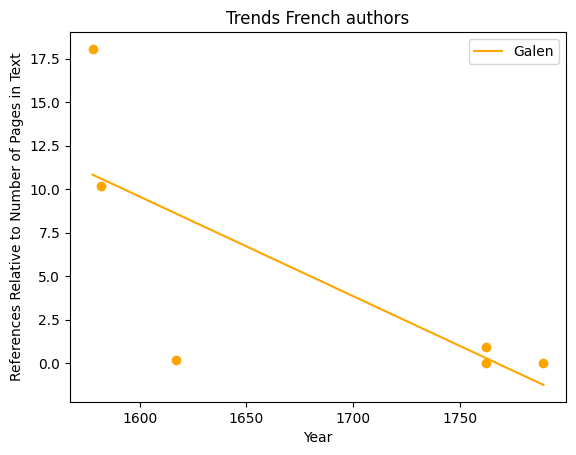
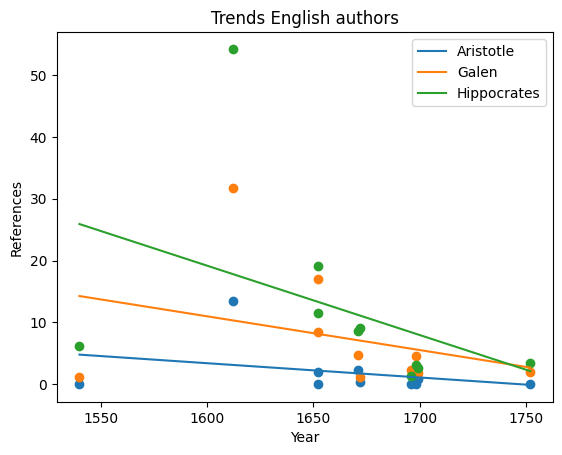
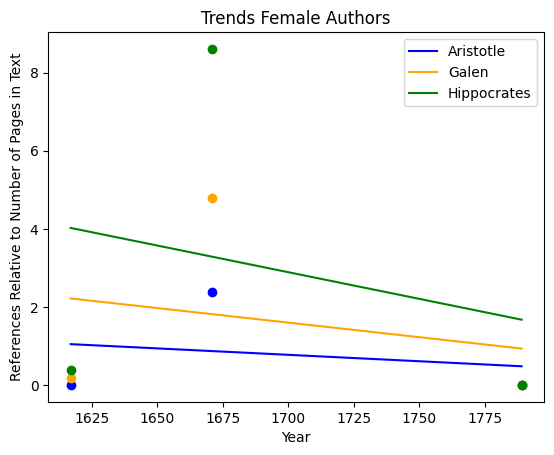
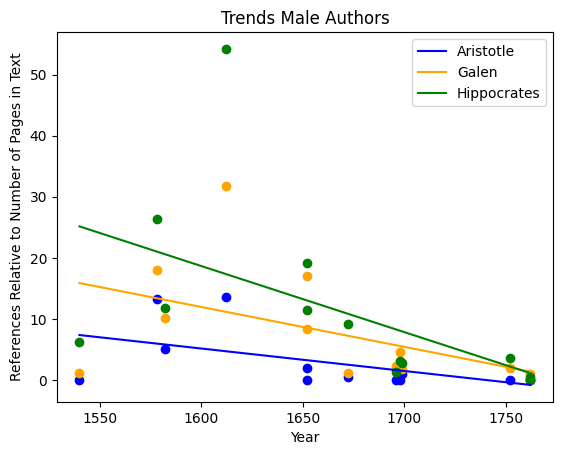
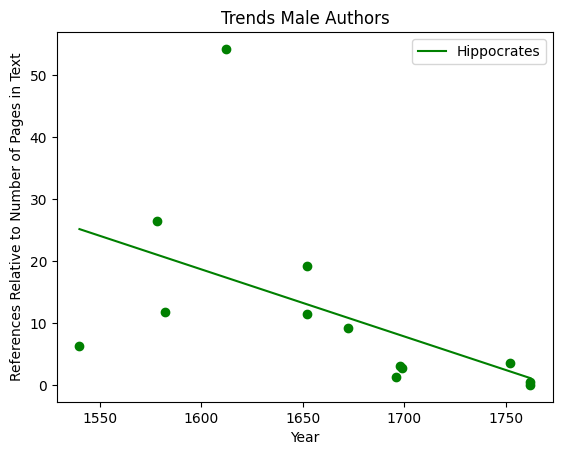
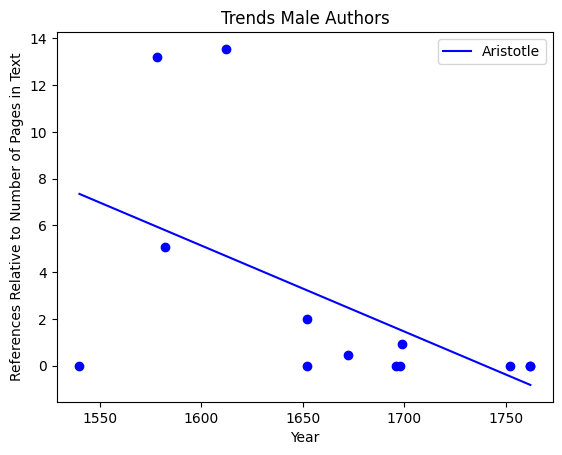
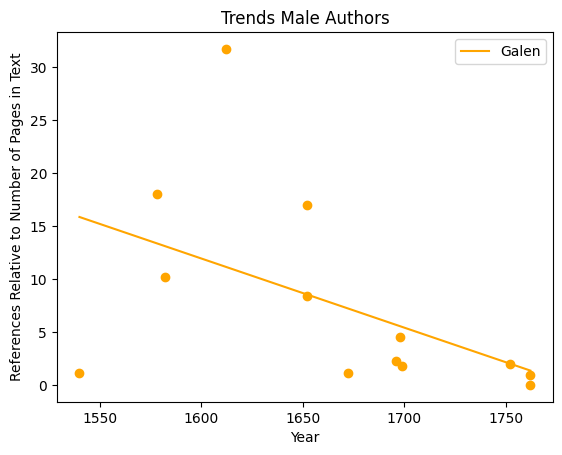
We used Python and Jupyter Lab to create these visualisations of references of those three Classical scholars. These graphs capture the amount of times each author is referenced, with a certain number of caveats; the semantic context is absent, so some references may actually be a refutation of Classical thought. However, these graphs do allow us to visualise the continued influence of and engagement with Classical knowledge that our authors exploit, either in agreement or in contention. They are stand alone visualisations as the y-axis is not directly comparable.
Understanding the Graphs
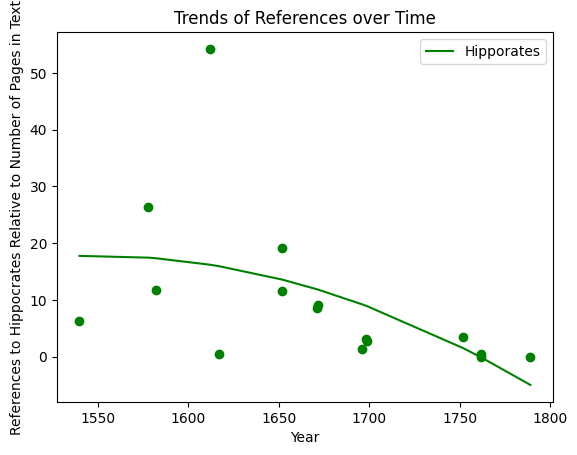
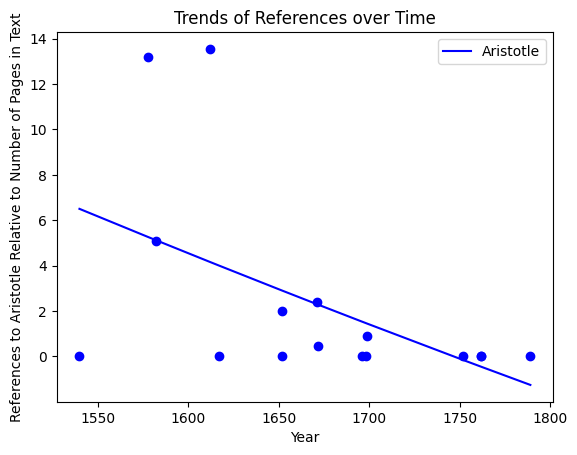
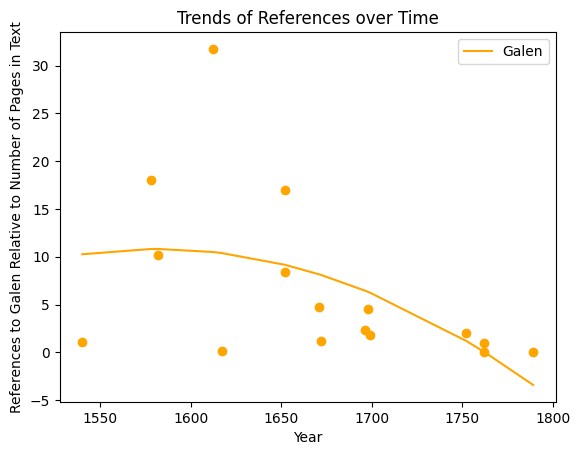
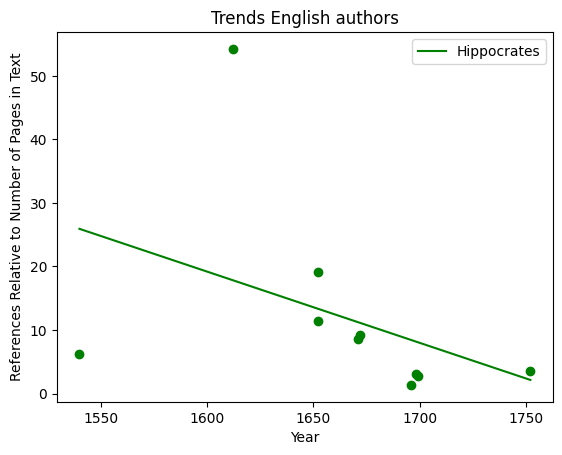
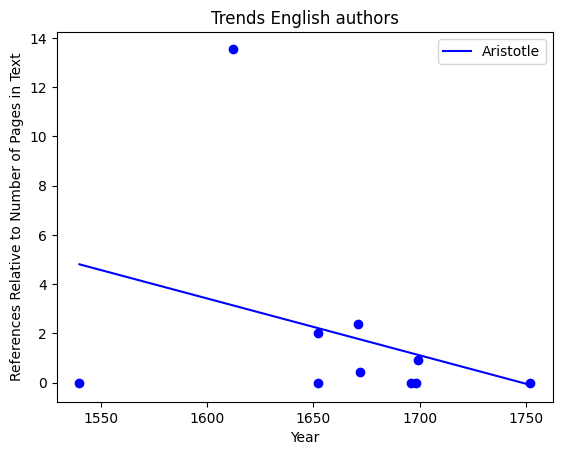
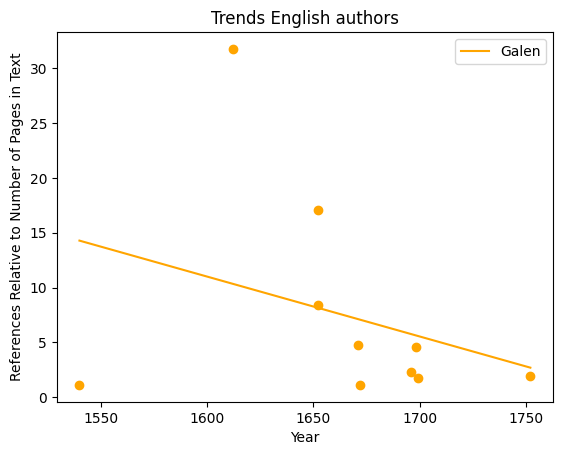
The y-axis is the percentage of references per page of the source. This allows us to compare texts that have different page numbers, for example some of our sources have only 111 pages while others have more than 600. The x-asis is time, beginning with the 16th century and ending with the 18th century.
Trends by Author in Full Corpus
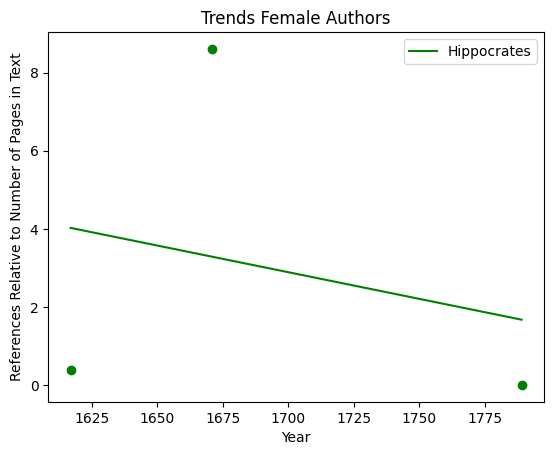
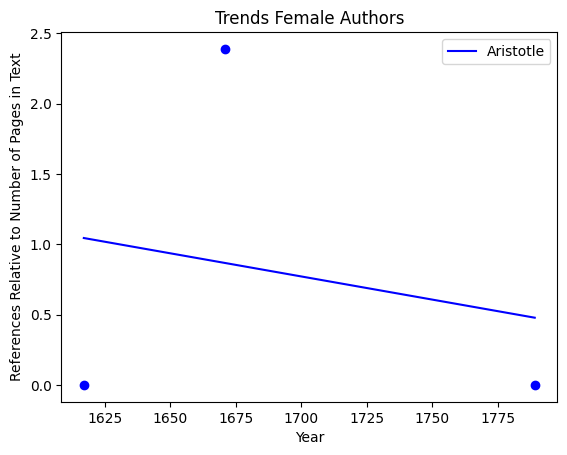
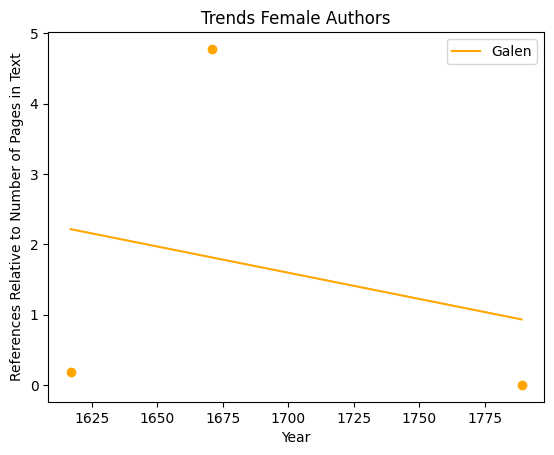
The first graph shows the composite trends for the three authors. The quadratic equation shows the overall trend of decline, while the points charted on the axis represent the references per page number of the source text. The graphs below contain the same information presented as a line graph, individually separated by author.
As the y-axis is different across the three graphs, they are not directly comparable as the scaling is different. They do however work in tandem with the composite graph as they display the information as invididual data points. We can clearly see the decline in referencres to these three Classical authors across the corpus.
Trends by Text Language
French
French
This composite graph displays the decline in references to these Classical authors in the French sources.
Trends by Gender of Author
Reusable Content
Reusable Content
As an open source project, we enourage the reuse of our data in other projects. The .csv file used to make these graphs can be downloaded here. The link for each source’s text file is included.
You can also download and resuse the Jupyter Notebook as HTML that we wrote in Python here.
